
Extracting NTPd Statistics for usage indicators
In this blog post, we will look to extract NTP statitics and visualizing these statistics on dashboards.
Activate logs on NTPd
To begin, we need to activate NTPd server logs.
This can be achieved by updating the NTPd configuration file located at /etc/ntp.conf.
Add the following lines to the configuration:
statsdir /var/log/ntpstats/
statistics peerstats sysstats
filegen peerstats file peerstats.log type day enable
filegen sysstats file sysstats.log type none enable
After making these changes, restart the NTPd daemon:
systemctl restart ntpd
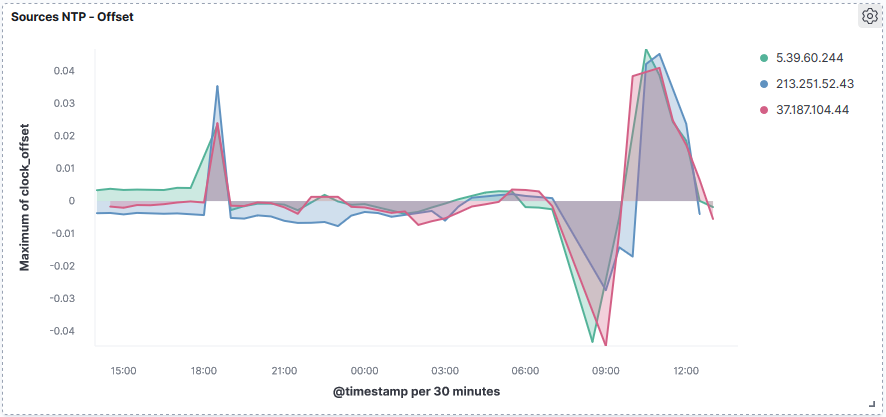
Understanding Peerstats
The peerstats log records statistics related to NTP peers. Each line in the peerstats log contains the following information:
| Units | Description |
|---|---|
| MJD | date |
| s | time past midnight |
| IP | source address |
| hex | status word |
| s | clock offset |
| s | roundtrip delay |
| s | dispersion |
| s | jitter |
Here’s an example of the peerstats log entry /var/log/ntpstats/peerstats:
58927 1293.735 91.224.149.41 941a -0.031646296 0.047783430 0.019218732 0.002787419
58927 1315.710 129.250.35.250 945a -0.033762728 0.027946319 0.019098537 0.001580388
58927 1848.736 193.141.27.6 941a -0.034690903 0.054624853 0.015236537 0.001218647
58927 2006.714 92.222.117.115 961a -0.033217220 0.031581741 0.015059831 0.001349028
Delay: Shows the round trip time (RTT) of your computer communicating with the remote server.Offset: Using root mean squares, it shows how far off your clock is from the reported time the server gave you. It can be positive or negative.Jitter: Represents the root mean squared deviation of your offsets.
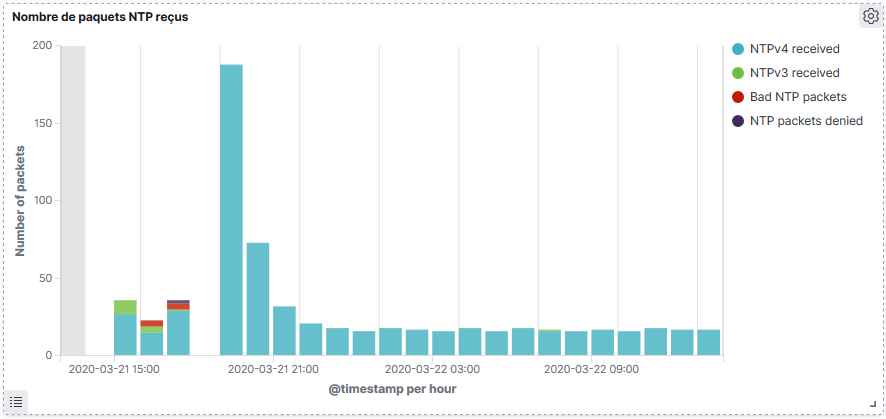
Understanding Sysstats
Sysstats log records various system statistics every hour. Each line in the sysstats log is in the following format:
| Units | Description |
|---|---|
| MJD | date |
| s | time past midnight |
| s | time since reset |
| packets received | |
| packets generated | |
| current versions | |
| old version | |
| access denied | |
| bad length or format | |
| bad authentication | |
| declined | |
| rate exceeded | |
| kiss-o’-death packets sent |
Example sysstats log entry /var/log/ntpstats/sysstats:
58927 52035.251 3599 225 205 225 0 0 0 0 0 0 0
58927 55635.257 3600 88 88 88 0 0 0 0 0 0 0
58927 59235.313 3600 49 49 49 0 0 0 0 0 0 0
Counting NTP clients
Unfortunately, NTPd does not provide information on the number of clients it serves. To address this, you can use iptables to log UDP port 123 traffic and monitor it. Here’s how:
Install iptables
yum remove firewalld && yum install iptables-services
systemctl enable iptables.service
Add the rule to log UDP port 123 traffic
/sbin/iptables -A INPUT -p udp --dport 123 -j LOG --log-prefix='[NTP] ' --log-level debug
/usr/libexec/iptables/iptables.init save
Create the rsyslog /etc/rsyslog.d/00-iptables.conf file to log NTP traffic in specific file
:msg,contains,"[NTP] " /var/log/ntpstats/iptables.log
Restart rsyslog
service rsyslog restart
Here’s an example of a log entry /var/log/ntpstats/iptables.log:
Mar 19 06:56:10 localhost kernel: [NTP] IN=enp0s3 OUT= MAC=08:00:27:96:57:49:a0:40:a0:8d:29:95:08:00 \
SRC=185.242.56.3 DST=10.0.0.33 LEN=76 TOS=0x00 PREC=0x00 TTL=44 ID=56768 \
DF PROTO=UDP SPT=123 DPT=123 LEN=56
Expected logs
After implementing the changes, you can expect to find log files in the /var/log/ntpstats directory:
[root@localhost ntpstats]# ll
total 740
-rw-------. 1 root root 669741 Mar 22 08:42 iptables.log
-rw-r--r--. 2 ntp  ntp    3549 Mar 22 07:14 peerstats.log
-rw-r--r--. 1 ntp  ntp   32829 Mar 21 00:58 peerstats.log.20200320
-rw-r--r--. 1 ntp  ntp   16910 Mar 22 00:59 peerstats.log.20200321
-rw-r--r--. 2 ntp  ntp    3549 Mar 22 07:14 peerstats.log.20200322
-rw-r--r--. 2 ntp  ntp     347 Mar 22 08:35 sysstats.log
-rw-r--r--. 1 ntp  ntp     980 Mar 21 00:46 sysstats.log.20200320
-rw-r--r--. 1 ntp  ntp    1041 Mar 22 00:35 sysstats.log.20200321
-rw-r--r--. 2 ntp  ntp     347 Mar 22 08:35 sysstats.log.20200322
Export Logs to ELK
We use the ELK stack to analyze and visualize these NTP logs we first need to deploy Filebeat:
Deploy Filebeat
Install filebeat, follow this procedure
Configure filebeat /etc/filebeat/filebeat.yml
filebeat.inputs:
- type: log
    enabled: true
    paths:
    - /var/log/ntpstats/iptables.log
    fields:
    logtype: iptables

- type: log
    enabled: true
    paths:
    - /var/log/ntpstats/peerstats.log
    fields:
    logtype: peerstats

- type: log
    enabled: true
    paths:
    - /var/log/ntpstats/sysstats.log
    fields:
    logtype: sysstats

output.logstash:
    hosts: ["<ip_logstash>:5044"]
Start filebeat
systemctl start filebeat
Configure Logstash
Configure logstah /etc/logstash/conf.d/00-beats.conf
input {
    beats {
        port => 5044
    }
}

filter {
    if( [fields][logtype] == "iptables"){
    dissect {
        mapping => { "message" => "%{} %{} %{} %{} kernel: [NTP] IN=%{} OUT=%{} MAC=%{} SRC=%{ntp_clientip} %{}" }
    }
    if([ntp_clientip] == "<ip1_ntp_peer") {
        drop {}
    }
    }
    if( [fields][logtype] == "peerstats"){
    dissect {
        mapping => { "message" => "%{datemjd} %{timepast_midnight} %{src_addr} %{status_word} %{clock_offset} %{roundtrip_delay} %{dispersion} %{rms_jitter}" }
    }
    mutate {
    convert => {
        "clock_offset" => "float"
        "roundtrip_delay" => "float"
        "dispersion" => "float"
        "rms_jitter" => "float"
        }
    }
    }

    if( [fields][logtype] == "sysstats"){
    dissect {
        mapping => { "message" => "%{date_mjd} %{timepast_midnight} %{timesince_reset} %{pkts_received} %{pkts_generated} %{pkts_ntpv4} %{pkts_ntpv3} %{pkts_denied} %{pkts_bad} %{bad_auth} %{declined} %{rate_exceeded} %{pkts_kiss}" }
    }
    mutate {
        convert => {
            "pkts_received" => "integer"
            "pkts_generated" => "integer"
            "pkts_ntpv4" => "integer"
            "pkts_ntpv3" => "integer"
            "pkts_denied" => "integer"
            "pkts_bad" => "integer"
            "bad_auth" => "integer"
            "declined" => "integer"
            "rate_exceeded" => "integer"
            "pkts_kiss" => "integer"
        }
    }
    }
}

output {
    elasticsearch {
        hosts => ["http://localhost:9200"]
        index => "%{[@metadata][beat]}-%{[@metadata][version]}"
    }
}