
Insights into your DNS traffic with DNS-collector
What is DNS-collector?
![]()
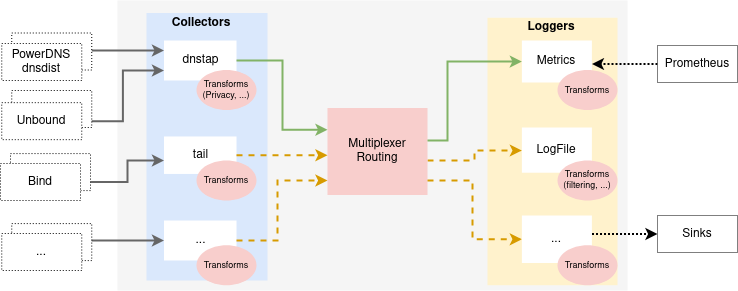
DNS-collector is an open-source DNS data collector written in Go started sinc august 2021. It acts as a passive high speed ingestor, aggregator and distributor for logs with usage indicators and security analysis.
DNS-collector can collect and aggregate DNS traffic from simultaneously sources like DNStap streams, network interface or log files and relays it to multiple other listeners with some transformations on it (traffic filtering, user privacy, …).
How to deploy DNS-collector with Docker
Before proceeding, please follow the guide Enabling DNStap logging on most popular DNS servers to ensure that your DNS traffic is sent to the collector.
Create the config.yml file
global:
  trace:
    verbose: false

pipelines:
  - name: tap
    dnstap:
      listen-ip: 0.0.0.0
      listen-port: 6000
    routing-policy:
      forward: [ console, prometheus ]
      dropped: [ ]

  - name: console
    stdout:
      mode: flatjson

  - name: prom
    prometheus:
      listen-ip: 0.0.0.0
      listen-port: 8081
You can find various examples on the github project.
Pull the image and start the container
sudo docker run -d -v $(pwd)/config.yml:/etc/dnscollector/config.yml --name dnscollector -p 6000:6000/tcp dmachard/go-dnscollector:latest
Display the logs
sudo docker logs dnscollector
You will observe output similar to the following:
{
  "dns.flags.aa":false,
  "dns.flags.ad":true,
  "dns.flags.qr":false,
  "dns.flags.ra":false,
  "dns.flags.tc":false,
  "dns.length":55,
  "dns.malformed-packet":false,
  "dns.opcode":0,
  "dns.qname":"www.google.com",
  "dns.qtype":"A",
  "dns.rcode":"NOERROR",
  "dns.resource-records.an":[],
  "dns.resource-records.ar":[],
  "dns.resource-records.ns":[],
  "dnstap.extra":"-",
  "dnstap.identity":"dnsdist",
  "dnstap.latency":0.000000,
  "dnstap.operation":"CLIENT_QUERY",
  "dnstap.timestamp-rfc3339ns":"2023-09-27T17:03:54.651904447Z",
  "dnstap.version":"dnsdist 1.8.1",
  "edns.dnssec-ok":0,
  "edns.options.0.code":10,
  "edns.options.0.data":"-",
  "edns.options.0.name":"COOKIE",
  "edns.rcode":0,
  "edns.udp-size":1232,
  "edns.version":0,
  "network.family":"IPv4",
  "network.ip-defragmented":false,
  "network.protocol":"UDP",
  "network.query-ip":"172.17.0.1",
  "network.query-port":"49458",
  "network.response-ip":"172.17.0.2",
  "network.response-port":"53",
  "network.tcp-reassembled":false
}
Visualizing usage indicators and logs from Loki and Grafana
Configure prometheus
Configure Prometheus to scrape metrics from DNS-collector:
  - job_name: 'dnscollector'
    scrape_interval: 5s
    basic_auth:
      username: 'admin'
      password: 'changeme'
    static_configs:
      - targets: [ dnscollector:8080 ]
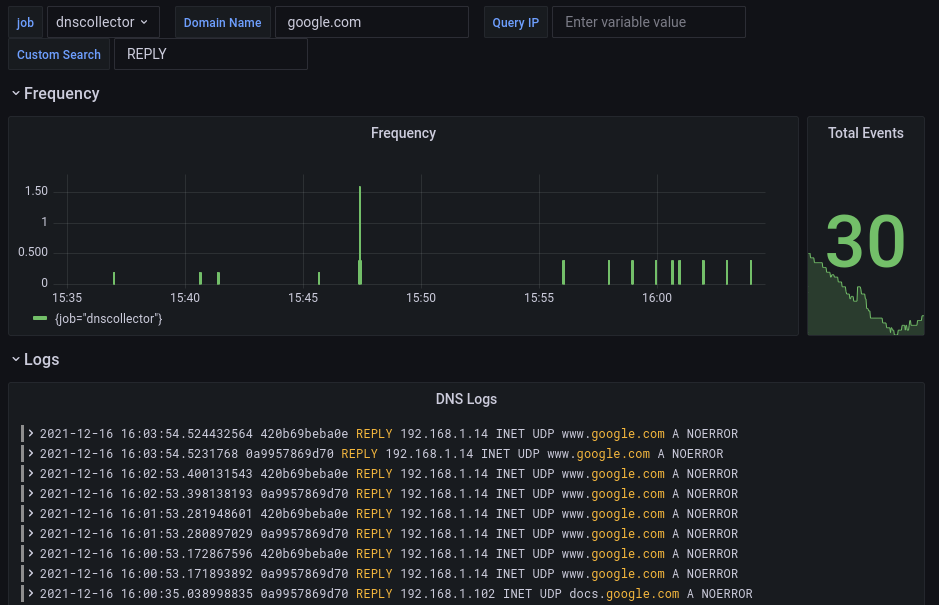
Loki
For tracing your logs in Loki, a build-in dashboard is available
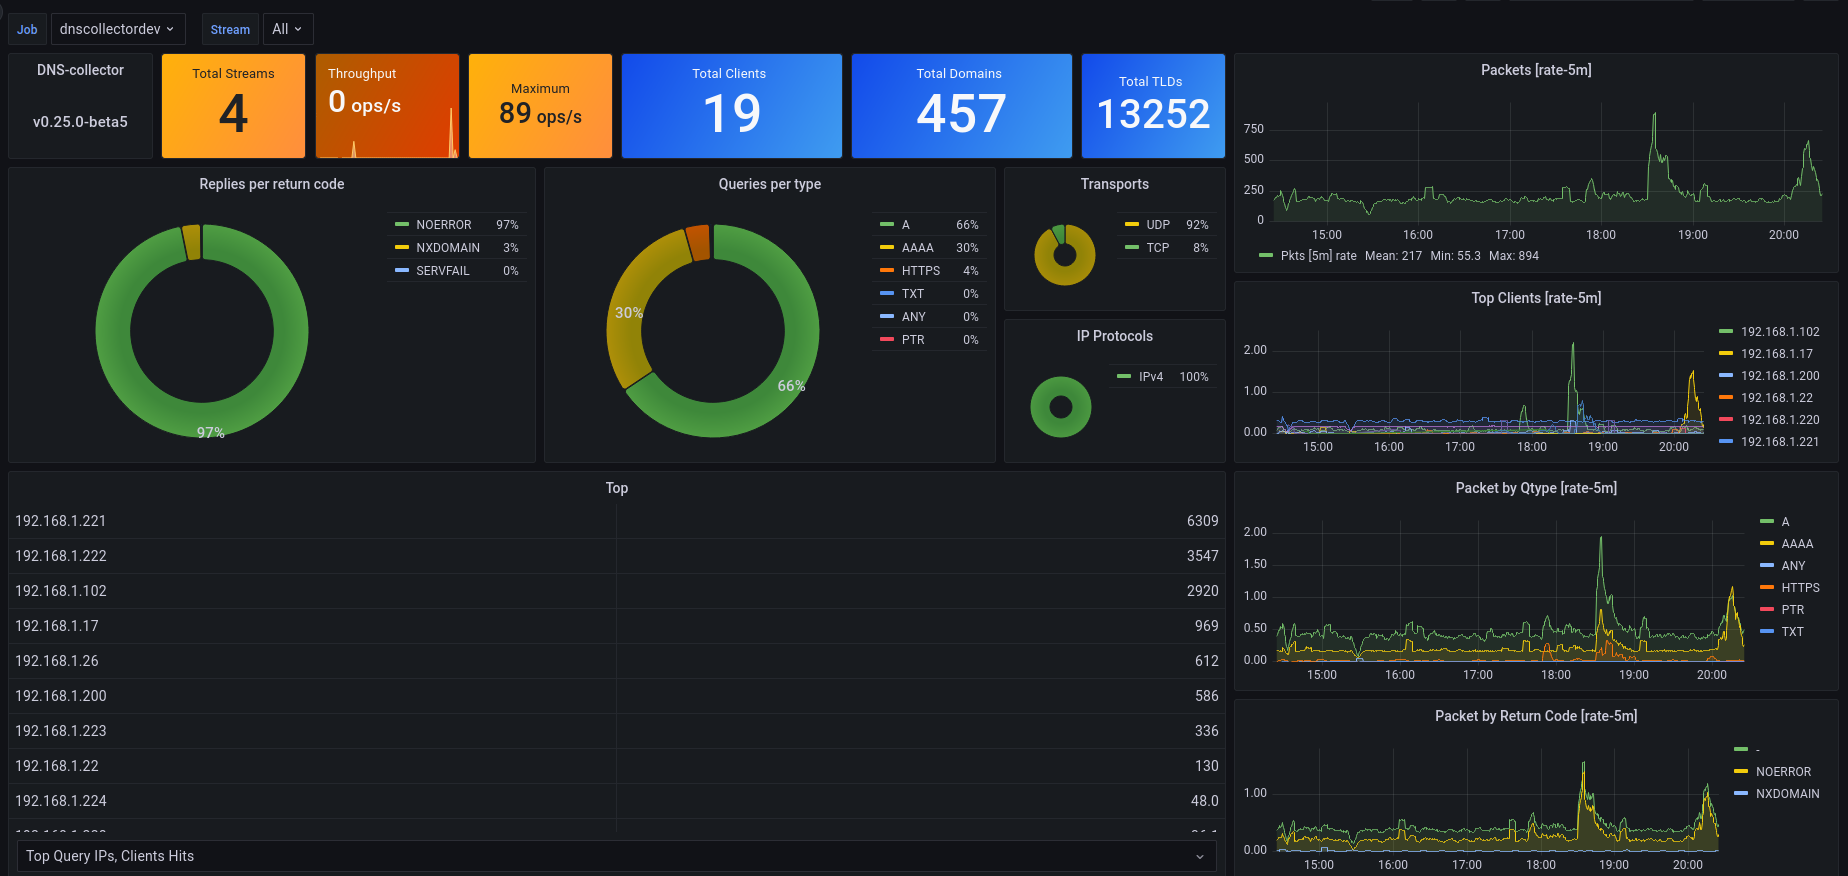
Grafana
Additionally, a build-in Grafana dashboard is provided to get usage indicators.
How to log slow DNS responses and DNS errors
This advanced example enable to log slow DNS responses and DNS errors
Create the config.yml file
global:
  trace:
    verbose: true

pipelines:
  # Listen on tcp/6000 for incoming DNSTap protobuf messages from dns servers
  - name: dnsdist_in
    dnstap:
      listen-ip: 0.0.0.0
      listen-port: 6000
    transforms:
      normalize:
        qname-lowercase: true
        qname-replace-nonprintable: true
      latency:
        measure-latency: true
    routing-policy:
      forward: [ filter-slow, filter-errors ]
      dropped: [ ]

  # keep only slow responses
  - name: filter-slow
    dnsmessage:
      matching:
        include:
          dnstap.operation: "CLIENT_RESPONSE"
          dnstap.latency:
            greater-than: 0.2
    routing-policy:
      forward: [ outputfile-slowresponses ]

  # keep only DNS errors responses (discard NOERROR and NXDOMAINS)
  - name: filter-errors
    dnsmessage:
      matching:
        include:
          dnstap.operation: "CLIENT_RESPONSE"
        exclude:
          dns.rcode:
            - NOERROR
            - NXDOMAIN
    routing-policy:
      forward: [ outputfile-dnserrors ]

  - name: outputfile-slowresponses
    logfile:
      file-path:  "/tmp/dnstap-slow.log"
      mode: flat-json

  - name: outputfile-dnserrors
    logfile:
      file-path:  "/tmp/dnstap-errors.log"
      mode: flat-json