Monitor DNS records with blackbox exporter
Example to monitor DNS records with the blackbox exporter and Prometheus
Blackbox
Configuration blackbox.yml
modules:
  www.google.com:
    prober: dns
    timeout: 5s
    dns:
      transport_protocol: "udp"
      preferred_ip_protocol: "ip4"
      query_name: "www.google.com"
      query_type: "A"
      valid_rcodes:
        - NOERROR

  www.microsoft.com:
    prober: dns
    timeout: 5s
    dns:
      transport_protocol: "udp"
      preferred_ip_protocol: "ip4"
      query_name: "www.microsoft.com"
      query_type: "A"
      valid_rcodes:
        - NOERROR
Reload the blackbox config
curl -X POST http://<ip_blackbox>:9115/-/reload
Prometheus
  - job_name: 'blackbox-dns-monitor'
    scrape_interval: 5s
    metrics_path: /probe
    relabel_configs:
    # Populate domain label with domain portion of __address__
    - source_labels: [__address__]
      regex: (.*):.*$
      replacement: $1
      target_label: domain
    # Populate instance label with dns server IP portion of __address__
    - source_labels: [__address__]
      regex: .*:(.*)$
      replacement: $1
      target_label: instance
    # Populate module URL parameter with domain portion of __address__
    # This is a parameter passed to the blackbox exporter
    - source_labels: [domain]
      target_label: __param_module
    # Populate target URL parameter with dns server IP
    - source_labels: [instance]
      target_label: __param_target
    # Populate __address__ with the address of the blackbox exporter to hit
    - target_label: __address__
      replacement: blackbox:9115

    static_configs:
      - targets:
        - www.google.com:8.8.8.8
        - www.microsoft.com:8.8.8.8
        - www.google.com:1.1.1.1
        - www.microsoft.com:1.1.1.1
        - www.google.com:9.9.9.9
        - www.microsoft.com:9.9.9.9
Reload the prometheus config
curl -X POST http://<ip_prometheus>:9090/-/reload
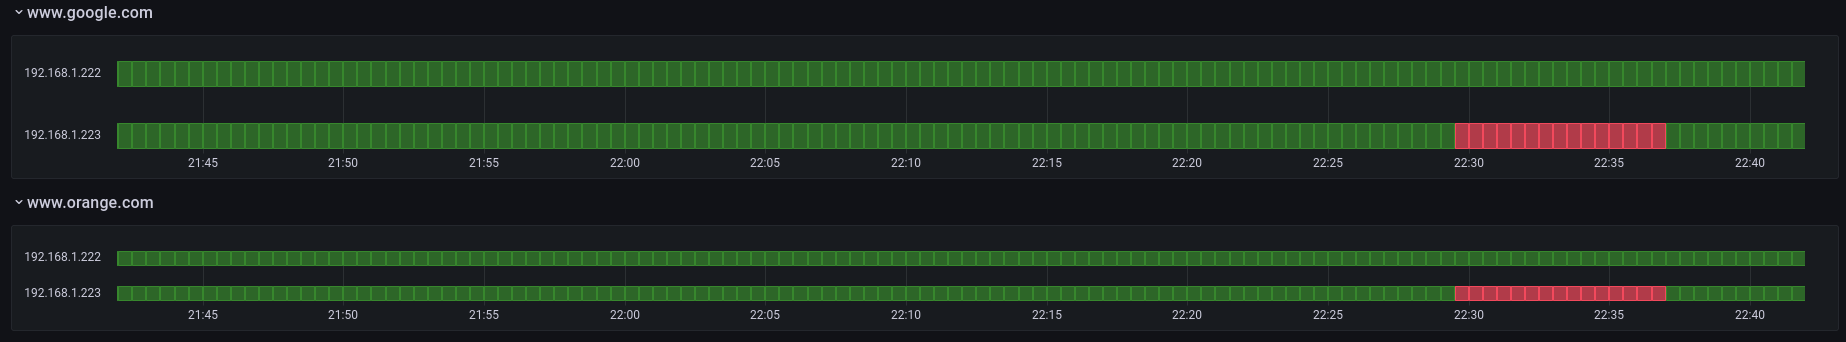
Grafana
Import the following dashboard.