Collect DNSTAP stream and analysing DNS logs with Loki and Grafana
Example to collect dnstap stream and analysing logs with Loki+Grafana
Prequisites
Install the dnscollector like described in the following guide.
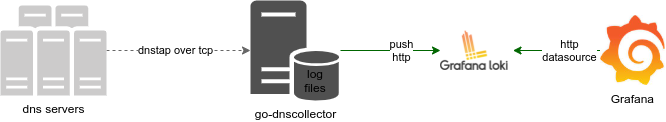
Overview
With this example the collector waits incoming dnstap messages sent by your dns server, then you can watch and analysing logs on your Grafana dashboard.
Configuration
Download the config.yml file.
global:
  trace:
    verbose: true

multiplexer:
  collectors:
    - name: tap
      dnstap:
        listen-ip: 0.0.0.0
        listen-port: 6000
        tls-support: true
        cert-file: "/etc/dnscollector/dnscollector.crt"
        key-file: "/etc/dnscollector/dnscollector.key"

  loggers:
    - name: loki
      lokiclient:
        server-url: "http://loki:3100/loki/api/v1/push"
        job-name: "dnscollector"
        text-format: "localtime identity qr queryip family protocol qname qtype rcode"

  routes:
    - from: [tap]
      to: [loki]
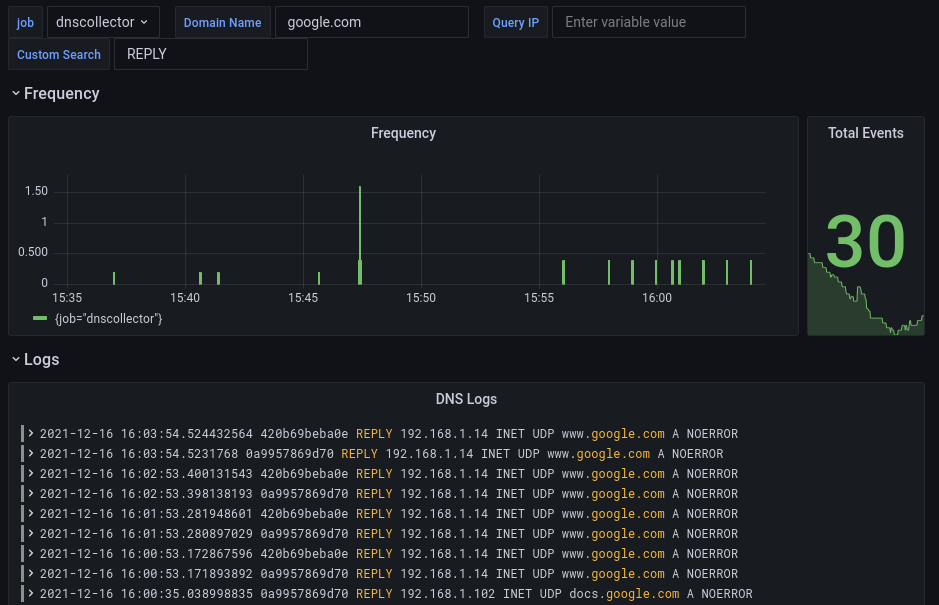
Dashboard
The dashboard can be found here.
A small overview