CoreDNS-GSLB: Observability
Prometheus Metrics
If you enable the prometheus block in your Corefile, the plugin exposes the following metrics on /metrics (default port 9153):
Enable in Corefile:
Available metrics:
| Metric Name | Labels | Description |
|---|---|---|
gslb_healthcheck_total |
name, type, address, result |
Total number of healthchecks performed. |
gslb_healthcheck_duration_seconds |
type, address |
Duration of healthchecks in seconds. |
gslb_healthcheck_failures_total |
type, address, reason |
Total number of healthcheck failures. reason can be: timeout, connection, protocol, other. |
gslb_record_resolution_total |
name, result |
Total number of GSLB record resolutions. |
gslb_record_resolution_duration_seconds |
name, result |
Duration of GSLB record resolution in seconds. |
gslb_record_health_status |
name |
Health status per record (1 = healthy, 0 = unhealthy). |
gslb_backend_health_status |
name, address |
Health status per backend (2 = disabled, 1 = healthy, 0 = unhealthy). |
gslb_backend_healthcheck_status |
name, address, type |
Healthcheck status per backend and type (2 = disabled, 1 = success, 0 = fail). |
gslb_config_reload_total |
result |
Total number of config reloads. |
gslb_backend_active |
name |
Number of active (healthy) backends per record. |
gslb_backend_selected_total |
name, address |
Total number of times a backend was selected for a record. |
gslb_healthchecks_total |
(none) | Number of healthchecks configured (total for all records/backends). |
gslb_backends_total |
(none) | Total number of backends configured (all records). |
gslb_records_total |
(none) | Total number of GSLB records configured. |
gslb_zones_total |
(none) | Total number of DNS zones configured. |
gslb_version_info |
version |
GSLB build version info (always set to 1). |
gslb_redis_connected |
(none) | Connection status to Redis (1 = connected, 0 = disconnected). |
gslb_redis_errors_total |
operation |
Total number of Redis errors labeled by operation. |
gslb_redis_operations_total |
operation, result |
Total number of Redis operations labeled by operation and result. |
You can then scrape metrics at http://localhost:9153/metrics
Grafana Dashboard
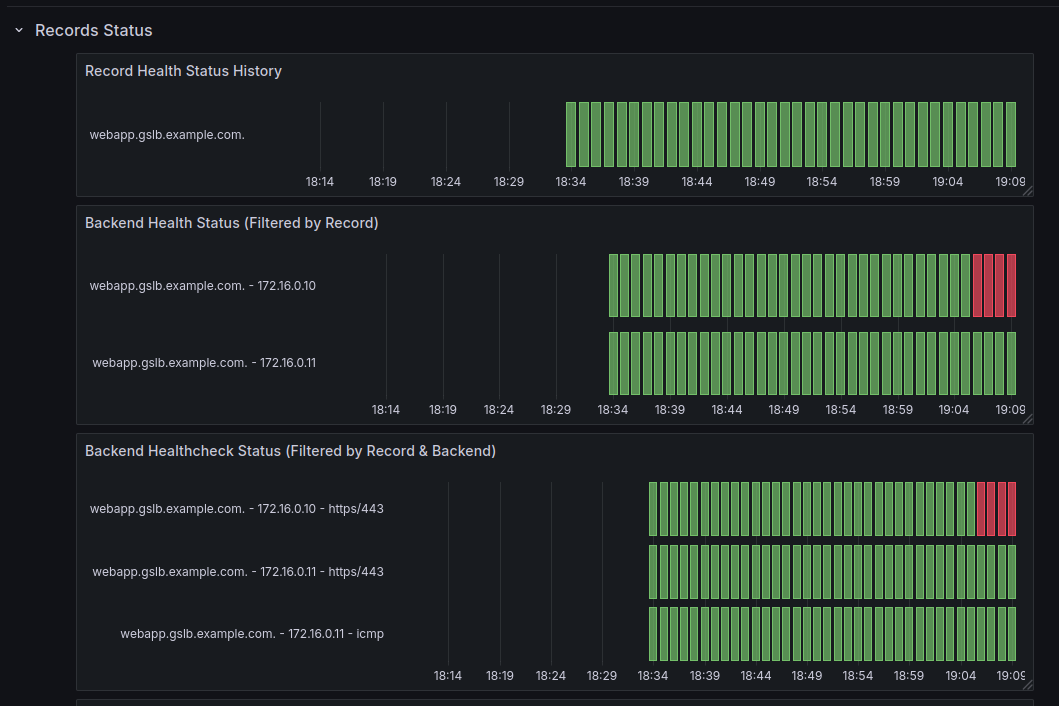
The dashboard is available in dashboards/gslb-observability.json
Using the Simplified Health Status Metrics
gslb_record_health_status{name="..."}: 1 if at least one backend is healthy, 0 if all are unhealthy or disabled.gslb_backend_health_status{name="...", address="..."}: 2 if backend is disabled, 1 if healthy, 0 if unhealthy.
Example Prometheus Queries
- Count unhealthy backends:
- Show 0 when all backends are healthy/disabled:
- Count healthy records:
- Count unhealthy records:
These queries ensure that Grafana panels always display 0 when everything is healthy, instead of showing nothing.