Logger: Loki client
The loki logger streams DNS event logs directly to a Grafana Loki log aggregation server via its HTTP push API.
It allows you to centralize DNS traffic logs alongside your other infrastructure telemetry, query them efficiently using LogQL, and build interactive Grafana dashboards for security monitoring, troubleshooting, and network analytics.
Messages can be formatted as plain text, structured JSON, or flat JSON, and are pushed in batches to maximize throughput and optimize ingestion efficiency on Loki.
Options:
-
server-url(string)Loki server url
-
job-name(string)Job name
-
mode(string)output format:
text,json, orflat-json -
flush-interval(integer)flush batch every X seconds
-
batch-size(integer)batch size for log entries in bytes
-
retry-interval(integer)interval in second between before to retry to send batch
-
text-format(string)output text format, please refer to the default text format to see all available text directives, use this parameter if you want a specific format
-
proxy-url(string)Proxy URL
-
tls-insecure(boolean)If set to true, skip verification of server certificate.
-
tls-min-version(string)Specifies the minimum TLS version that the server will support.
-
ca-file(string)Specifies the path to the CA (Certificate Authority) file used to verify the server's certificate.
-
cert-file(string)Specifies the path to the certificate file to be used. This is a required parameter if TLS support is enabled.
-
key-file(string)Specifies the path to the key file corresponding to the certificate file. This is a required parameter if TLS support is enabled.
-
basic-auth-login(string)basic auth login
-
basic-auth-pwd(string)basic auth password
-
basic-auth-pwd-file(string)path to a file containing the basic auth password
-
tenant-id(string)tenant/organisation id. If omitted or empty, no X-Scope-OrgID header is sent.
-
relabel-configs(list)configuration to relabel targets. Functionality like described in https://grafana.com/docs/loki/latest/clients/promtail/configuration/#relabel_configs.
Default values:
lokiclient:
  server-url: "http://localhost:3100/loki/api/v1/push"
  job-name: "dnscollector"
  mode: "text"
  flush-interval: 5
  batch-size: 1048576
  retry-interval: 10
  text-format: ""
  proxy-url: ""
  tls-insecure: false
  tls-min-version: 1.2
  ca-file: ""
  cert-file: ""
  key-file: ""
  basic-auth-login: ""
  basic-auth-pwd: ""
  basic-auth-pwd-file: ""
  tenant-id: ""
  relabel-configs: []
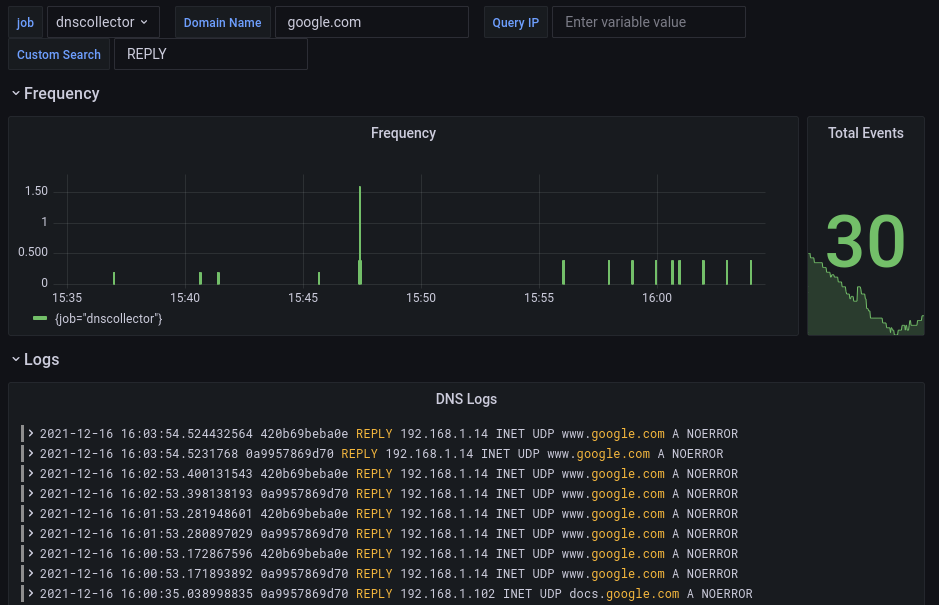
Grafana dashboard with Loki datasource
The following built-in dashboard is available.
You can also download the raw dashboard configuration directly: