Telemetry & Monitoring
DNS-collector exposes extensive internal telemetry metrics, allowing you to monitor the health, performance, CPU usage, memory allocations, and active goroutines of the DNS-collector process itself.
Why Enable Telemetry?
By enabling process telemetry, you gain real-time visibility into:
- Ingress and egress message rates per pipeline worker.
- Dropped and discarded message counts (crucial for buffer sizing and bottleneck detection).
- System resource usage (CPU, memory allocations, garbage collection cycles, active goroutines count).
How to Enable Telemetry
To start exposing Prometheus metrics, enable telemetry in the global section of your configuration:
global:
  telemetry:
    enabled: true
    web-listen: ":9165"
    web-path: "/metrics"
    prometheus-prefix: "dnscollector"
Once enabled, you can access the raw Prometheus metrics at http://localhost:9165/metrics and point your Prometheus scraper to this endpoint.
Grafana Dashboard
To help visualize the internal metrics of the DNS-collector binary, a pre-configured Grafana dashboard is available:
- Go Runtime Exporter Dashboard — Tracks CPU usage, memory allocations, garbage collection cycles, and active goroutines of the DNS-collector process.
You can download the raw dashboard configuration directly:
Dashboard Preview
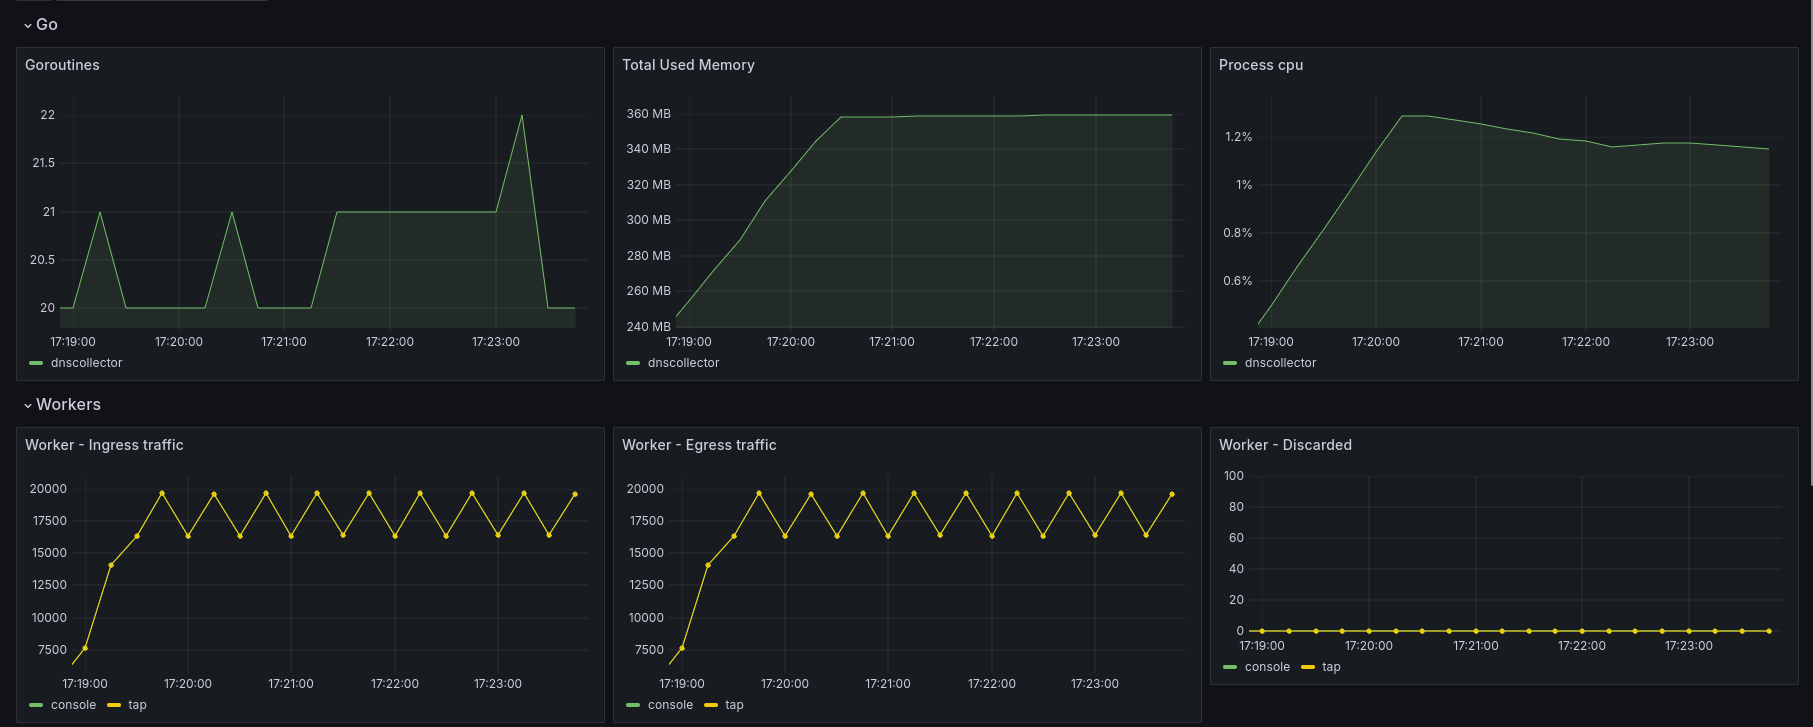
Process Performance Metrics
In addition to standard Go runtime metrics, the telemetry endpoint exposes internal pipeline metrics to track performance and detect bottlenecks:
Pipeline & Worker Throughput
-
dnscollector_worker_ingress_traffic_totalTotal number of DNS messages received by each pipeline worker. This reflects successful handoff to the next internal processing stage.
-
dnscollector_worker_egress_traffic_totalTotal number of DNS messages successfully forwarded out by each worker. Note: This does not guarantee delivery to remote external systems.
-
dnscollector_worker_discarded_traffic_totalThe number of messages dropped when worker output channels/buffers are full (e.g., due to slow loggers or network bottlenecks).
-
dnscollector_policy_forwarded_totalTotal number of DNS messages forwarded after matching policy rules.
-
dnscollector_policy_dropped_totalTotal number of DNS messages dropped by active policy rules.